Full article published in the Baseball Research Journal (Fall, 2019)
by: George G. Rigakos and Mitchell Thompson
Summary:
The purpose of this article is to explore the feasibility of an RPI ranking system for Canadian university baseball. The Rating Percentage Index (RPI) is the most commonly used method for ranking a large number of teams that play a relatively small schedule. Most famously adopted in the NCAA, RPI is used to rank teams nationally when most teams never have an opportunity to play one another. The premise of the RPI is that since most teams do not play each other, it would be unfair to rank teams based on wins and losses as in the NFL, NBA, and MLB, or based on a points system as in the NHL. Instead, RPI uses the strength of a team’s schedule in order to judge the quality of their play.
RPI is a mathematical calculation of a team’s strength of schedule. It is the sum of three components: Winning Percentage (WP), Opponent’s Winning Percentage (OWP), and Opponent’s Opponent’s Winning percentage (OOWP), each of which is weighted differently. The Formula for RPI is as follows:
RPI = (0.25 * WP) + (0.5 * OWP) + (0.25 * OOWP)
A team’s WP is the percentage of games that a team wins, expressed — in a form similar to batting average — as a decimal to three digits. This is calculated by dividing the total team wins by total games played.
In the Tables below we rank all participating teams in the OUA and CCBA from 2016 to 2018 by season. We use all available data culled from GameChanger, Pointstreak, and OUA Presto results. We also include all available inter-conference, pre-season, and playoff scores.
Results
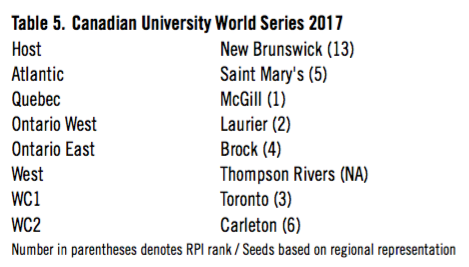
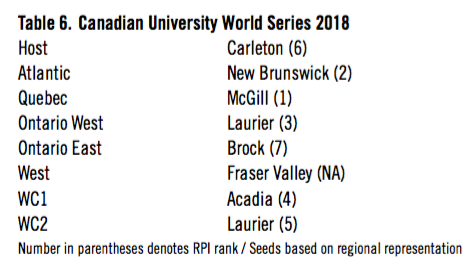
Applying the RPI calculation to our dataset by season we arrive at the following rankings for 2016, 2017, and 2018.
The results at the top end of the spectrum are not surprising. Teams that had excellent win-loss records and success in play-offs also placed very high in the overall rankings. McGill won three CCBA championships in this period and had the best overall win-loss record. They had won 30 consecutive league games until Carleton beat them in 2018.
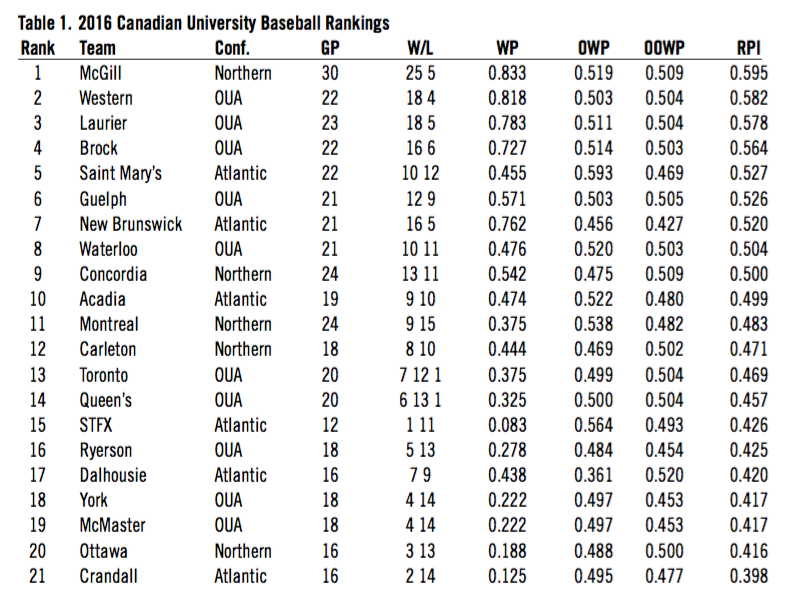
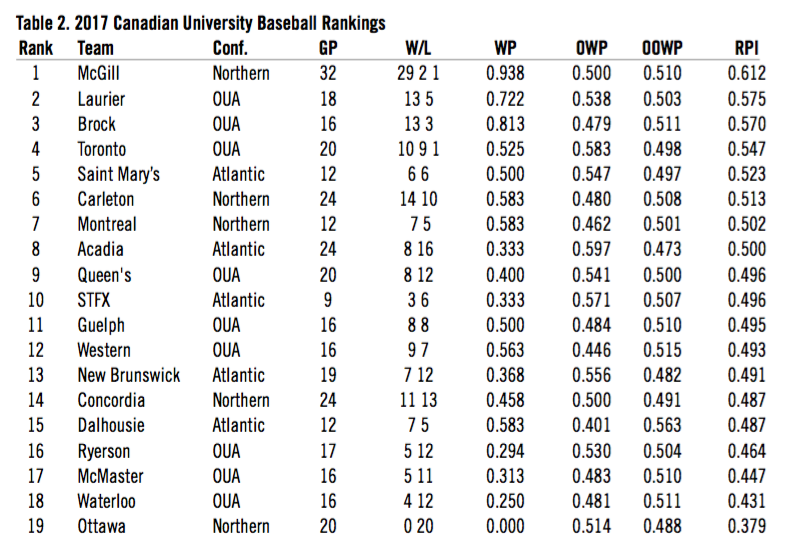
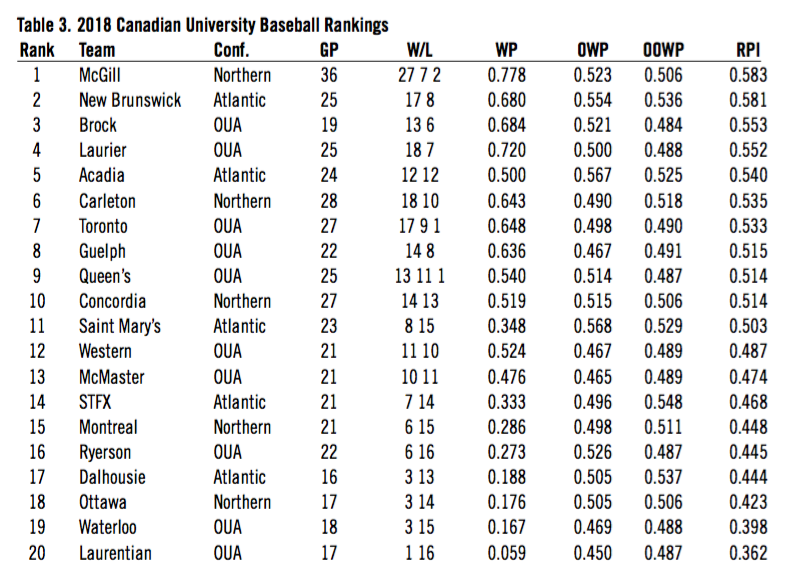
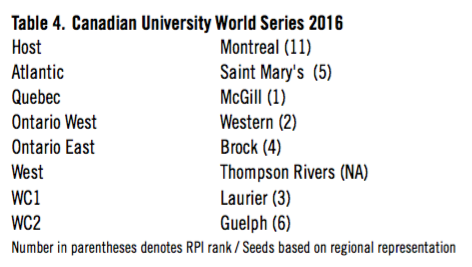
By way of illustration, we also seeded eight teams in a series of hypothetical Canadian University World Series for each of the 2016, 2017, and 2018 based on RPI and regional/conference representation. We selected the highest RPI ranked team by region. As was the practice in the CCBA, one spot is reserved for the host team. We simply reproduced those same hosts in our model. As the more isolated CCBC (West) did not play inter-conference games, included two-year colleges in its schedule, and was excluded from our calculations, we seeded the highest finishing four-year university team at the CCBC championship tournament as the western representative. Finally, as was the practice in the CCBA national championship, we made room for wild card entries. In our case, after regional seeds were determined, we took the next two highest RPI ranked teams that had not already been seeded.
Limitations
As effective and convenient as RPI is for comparing teams, it also has one foundational flaw: no ranking system can compare how two teams would stack up against one another quite like having those teams play head-to-head. There is no way to fix this. Unless, of course, the University of New Brunswick in the Atlantic flies to St. Catharines in Central Canada to play Brock in a weekend double header, or Queen’s University in Eastern Ontario wants to travel to Wolfville, Nova Scotia to play Acadia. As we mentioned, this is highly improbable as it involves significant interprovincial and trans-Canada travel. Moreover, for win-loss records to be the basis of rankings, the schedule would have to be balanced and complete so one could properly seed teams based on head-to-head competition. In the absence of such a schedule, we have the RPI.
Yet, what many analysts particularly dislike about the RPI formula is that so much weight is placed on the question: “How good are the teams you play?” There are three accompanying limitations associated with this weighting that affects the rankings we have presented in this paper: (1) conference strength, (2) the use of post-facto results, and (3) the importance given to pre-season games.


